
How Does Water Pollution Affect Human Health?

Water pollution refers to the contamination of water by substances that make it unsafe for drinking, cooking, cleaning, swimming, and other activities according to the Harvard T. H. Chan School of Public Health. Water pollution damages the ability of natural ecosystems to function properly and is detrimental to plants, animals, soil, and air.
Common sources of pollution include naturally occurring toxic geologic agents such as heavy metals, agricultural and industrial chemicals, hydrocarbon fuels, mining wastes, nuclear waste, garbage, septic tank and landfill leakage, sewage, pharmaceutical drugs, and bacterial, parasitic, and viral pathogens.
Human contact with polluted water through drinking, skin contact or even consumption of food that is grown or prepared using polluted water poses a significant danger to health. Pollutants in water may directly cause disease or act as poisons.
Hazardous chemicals from farms, industries, and homes that pollute water sources can cause acute toxicity and immediate death, or chronic toxicity complicated by neurological problems and cancers.
Infectious pathogens contaminating water through sewage can lead to gastrointestinal diseases, which are a significant cause of morbidity and mortality worldwide.
Table of Contents
- What Are the Pollutants in Water That Affect Human Health?
- What Are the Harmful Sources and Causes of Water Pollution?
- 1. Agricultural Water Pollution
- 2. Sewage Water Pollution
- 3. Garbage and Plastics
- 4. Radioactive Waste in Water
- 5. Oil Spills
- 6. Water Pollution after Fracking
- How Can Water Pollution Harm People?
- 1. Drinking Water Polluted by Sewage
- 2. Consuming Water That Contains Chemical Contaminants
- 3. Consuming Microplastics That Are In Polluted Water
- What Diseases and Health Problems Can Water Pollution Cause?
- What Are the Dangers of Water Pollution on the Environment?
- How Do Bottled Water Brands Prevent Water Pollution?
What Are the Pollutants in Water That Affect Human Health?
The pollutants in water that affect human health include the drinking water contaminants items in this list.
- Arsenic
- Copper
- Lead
- Chromium
- Perchlorate
- Fossil fuels such as gasoline
- Microplastics
- Pharmaceutical drugs
- Biocontaminants including bacteria, viruses, and parasites
- Nitrates and nitrites
- Pesticides
- Disinfection byproducts such as chloroform
- Radioactive materials
These pollutants are hazards because of their particularly negative effect on human health.
- Arsenic: As many as 140 million people worldwide are exposed to arsenic levels in drinking water that are higher than the World Health Organization's (WHO) provisional guideline of 10 μg/L. Most of this arsenic occurs naturally, but there is industrial and agricultural contamination. The International Agency for Research on Cancer has implicated arsenic as a cause of lung, bladder, skin, and kidney cancer. The National Institute of Environmental Health Sciences in the United States has linked arsenic exposure to chronic cough, diminished lung function, diabetes, developmental effects in children, decreased cognitive functioning, ischemic heart disease, and chronic renal disease.

- Copper: Copper contamination of drinking water occurs as a result of leaching from old copper pipes. Copper pipes were first introduced in the 1930s and gained widespread use throughout the 20th century, with almost all homes being equipped with copper plumbing. High levels of exposure can produce symptoms of gastrointestinal distress including nausea, vomiting, and abdominal pain. Modern copper piping is generally safe and does not release dangerous materials into water.
- Lead: Lead is sometimes found in old pipes which can give it a direct route into the water supply (as occurred in Flint, Michigan and ancient Rome). Ingestion of water polluted with lead can cause central nervous system health problems such as headaches, fatigue, muscle weakness, delirium, or seizures. Other symptoms of lead exposure can include kidney disease, anemia, or severe abdominal pain (lead colic). The World Health Organization (WHO) estimates that globally over 240 million people are exposed to lead-contaminated water. They estimate that acute and chronic lead exposure accounts for over 850 thousand deaths per year.
-
Chromium: Water pollution by chromium can occur through industrial contamination or from chromium that is naturally occurring and leaches from topsoil or rocks. Hexavalent chromium(Cr[VI]) is manmade and is the type that is particularly toxic to humans. It is used in chrome plating, dye production, textile production, leather tanning, Portland cement, stainless steel production, welding, and wood treatment.
 Chromium polluted water can cause rashes as pictured above, renal and liver toxicity, gastrointestinal irritation and cancer, sperm damage, or anemia. Drinking water contributes substantially to chromium intake, especially when total chromium levels are above 25 μg/liter. The WHO’s publication Guidelines for Drinking-water Quality (GDWQ) reports that approximately 18% of the US population is exposed to drinking water chromium levels between 2 and 60 μg/liter and less than 0.1% to levels between 60 and 120 μg/liter.
 - Perchlorate: Water pollution by perchlorate can occur through industrial contamination or from perchlorate that is naturally occurring. Perchlorate has been used industrially as an oxidizer in solid rocket propellants, slurry explosives, road flares and airbag inflation systems. Perchlorate water pollution inhibits iodide uptake by the thyroid gland. A study from the National Institute of Health in the United States found that decreased thyroid hormones during pregnancy and early childhood lead to decreased cognitive development and IQ. The United States Water Works Association detected perchlorate in the drinking water of at least 26 states and in approximately 5% of public water systems.
- Fossil Fuels: Fossil fuel extraction and processing can lead to water contamination with a variety of pollutants such as polycyclic aromatic compounds, heavy metals, benzene, methane and other natural gases. These pollutants can threaten human health in ways ranging from respiratory problems to harming the nervous and reproductive systems. A 2003 study published in the Annual Review of Environmental Resources found that US oil refineries release approximately 50,000 barrels (8 million liters) of petroleum by-products per day, a quarter of which makes its way into the US water system and contaminates drinking water with a variety of toxins.
- Microplastics: The United States National Oceanic and Atmospheric Administration (NOAA) states that plastic is the most prevalent type of aquatic debris found in oceans and lakes and defines microplastics (MPs) as small plastic pieces that are less than five millimeters in length. Professor Kurunthachalam Kannan and Dr. Krishnamoorthi Vimalkumar of the New York University School of Medicine reported that per capita intake of microplastics likely ranges from 39 to 52 thousand particles per year, with seafood consumption leading to particularly high levels. Unfortunately, not much is known about the impact of microplastics on human health. Potential health risks include altered metabolism, immune disruption, accumulation in distant organs, neurotoxicity, and reproductive toxicity.

- Pharmaceutical Drugs: Pharmaceuticals refer to active synthetic or natural chemicals that are found in prescription medicines, over-the-counter therapeutic drugs and veterinary drugs. The widespread use of pharmaceutical agents in medicine and agriculture has led to environmental pollution. The 2012 WHO report on Pharmaceuticals in drinking-water states that the concentration of pharmaceutical agents in surface and drinking water ranges from nanograms to low micrograms per liter. Concentrations of pharmaceuticals in surface water and groundwater sources impacted by wastewater discharges are typically less than 100 ng/L and concentrations in treated drinking water are usually well below 50 ng/L. Adverse human health impacts are very unlikely from exposure to these trace concentrations of pharmaceuticals in treated drinking water.
- Biocontaminants: Biocontaminants refer to bacteria, viruses, or parasites which pollute water that humans use for drinking and daily activities. Bacterial waterborne disorders are associated with organisms such as Escherichia coli and Cyanobacteria among others. Cyclospora species, Cryptosporidia, and Giardia continue to be the most frequent parasitic biocontaminants of water supplies. Drinking water can be contaminated by a variety of viruses including Hepatitis A and adenoviruses. The most common health effect of waterborne biocontamination is acute diarrheal disease which is characterized by loose watery stools, often accompanied by vomiting and fever. According to the WHO, acute diarrheal disease related to biocontamination of drinking water affects nearly 1.7 billion children globally and is the second leading cause of death in this demographic, claiming 525,000 lives each year. Below, the very infectious adult Cyclospora species is shown in a laboratory finding.

- Nitrates and Nitrites: Nitrates are naturally occurring chemicals that form when nitrogen is combined with oxygen or ozone. Although nitrates are commonly found in food and food preservatives, the most common source of nitrates is industrial fertilizers. European Union standards require nitrates in drinking water to be less than 10.0 mg/L, while nitrites must be less than 50 μg/L. If nitrate or nitrite levels are higher than this, remedial action must be taken immediately to reduce them or fines or withdrawal of production permission can result.
- Pesticides: Pesticides pose a risk of contaminating drinking water supplies. Agricultural chemicals including herbicides, insecticides and fungicides produce serious water pollution problems. These chemicals have been shown to have a wide range of effects ranging from male sterility and cancers to poor childhood neurodevelopment. The USGS reports that approximately 390 million kilograms of these chemicals are used annually with some of them contaminating critical sources of drinking water. A recent 2021 USGS study reported that 16 "urban signature pesticides" (USPs) were consistently found in small streams in urban centers across five regions of the United States.
- Disinfection By-Products (DBPs): Chemicals such as chlorine and ozone are often added to drinking water as disinfection agents that kill harmful bacteria, protozoa, and viruses. However, in the presence of organic material such as decaying plants or algae, potentially toxic disinfection by-products are formed when chlorine is added to water. DBPs have been linked to health effects including anemia as well as hepatic, renal, and central nervous system toxicity. The International Agency for Research on Cancer has classified DBPs including chloroform, bromodichloromethane, dibromoacetic acid, dichloroacetic acid as possibly carcinogenic as associations between these chemicals in water and cancers of the bladder and gastrointestinal tract have been found. As most drinking water is treated by disinfectants to kill pathogens, DBPs are present in almost all drinking water in developed countries. Levels of DBPs are rigorously monitored and Maximum Contaminant Levels (MCL) are established for DBPs that are formed in drinking water.
- Radioactive Materials: Radioactive minerals such as radium, radon, uranium, tritium, thorium as well as their decay products can contaminate surface and groundwater and are referred to as radionuclides. Contamination of groundwater and drinking water sources by radionuclides can occur as a result of industrial pollution or from erosion of natural deposits. Elevated concentrations of waterborne radionuclides have been linked to increased childhood leukemia rates as well as an overall increased cancer risk. A 2021 study by the USGS of groundwater quality in aquifers in Colorado, Nebraska, Kansas, and Oklahoma found that radioactive constituents existed in high concentrations in 12% of the area studied, and at moderate levels in 17% of the area.
What Are the Harmful Sources and Causes of Water Pollution?
This is a list of harmful sources and causes of water pollution.
- Agricultural water pollution
- Sewage water pollution
- Garbage and plastics
- Radioactive waste in water
- Oil spills
- Water pollution after fracking
Sources of water pollution refer to those human activities or practices through which harmful chemical substances are allowed to make their way into bodies of water. The most common and destructive sources of water pollution are the runoff of pesticide-contaminated agricultural water and the indiscriminate disposal of industrial, municipal and domestic wastes in water channels, rivers, streams and lakes. The major industries that contribute to water pollution deal with food, agriculture, fertilizer factories, petrochemicals, mining, steel, and pharmaceuticals.
1. Agricultural Water Pollution
Globally, agriculture accounts for 70% of all water consumption, resulting in inevitable contamination with pesticides. Agricultural runoff is the most common source of agricultural water contamination. In the past 50 years, the development of chemically invasive agriculture with the use of pesticides applied in solution, suspension, or as wettable concentrates and powders to control weeds, insects, and other pests has produced serious water pollution problems with widespread contamination of drinking and groundwater supplies of wells and rivers.
Typical sources of agricultural pollution include runoff from farmyards or storage facilities, field runoff, drainage/leaching into the subsurface, or spray drifts of various pesticides. This picture of a farm field in Iowa during heavy rains shows how both topsoil and fertilizers wash away and eventually enter larger waterways. The image is from the US Department of Agriculture’s Natural Resources Conservation Service.

The degree of agricultural water pollution is so vast, that the United States Geological Survey reported that every stream and the majority of all groundwater sources tested in the US contained at least one agricultural chemical contaminant.
2. Sewage Water Pollution
Sewage is wastewater from things such as toilets, sinks, baths, showers, washing machines, and dishwashers. As well as runoff from streets, lawns, farms, and other land areas that may contain chemicals, oils, pesticides, fertilizers, and animal excreta.
While modern wastewater treatment plants keep far more sewage out of the environment than in the past, the reality is that a great deal of sewage still ends up in rivers, streams, lakes, and oceans through groundwater or direct dumping. Especially in developing countries with weaker regulations and enforcement. This becomes an issue when untreated sewage reaches drinking water sources and starts to pose significant health risks to the community.
For example, sewage-contaminated drinking water is often the cause of cholera in developing countries. The WHO reports that annually there are approximately 2.9 million cases and 95 thousand deaths due to cholera in at least 47 endemic countries. Cholera is a type of bacterial gastroenteritis caused by Vibrio cholerae, and is characterized by profuse 'rice-water' stools, frequently accompanied by fever and vomiting.
This video from Vice News tells the story of how sewage runoff from a UN base in Haiti led to a cholera outbreak that killed ten thousand people in the wake of the 2010 earthquake.
3. Garbage and Plastics
Garbage that pollutes rivers, lakes, streams, and creeks is termed “aquatic trash” by the United States Environmental Protection Agency (EPA). Once aquatic trash has made its way into the ocean, it becomes “marine debris” which NOAA defines as “any persistent solid material that is manufactured or processed and directly or indirectly, intentionally or unintentionally, disposed of or abandoned into the marine environment”.
Garbage can make its way into the aquatic world in a variety of ways. The most common culprits are litter from improperly stored recycling, compost, or trash bins; pedestrian littering; illegal dumping of household waste in or near waterways; and litter from cars and trucks. Eventually, large volumes of garbage make their way into the aquatic environment with the help of rain, wind, and storm drains.
The extent of worldwide aquatic pollution is vast. The 2020 International Coastal Cleanup project collected 2,371,865 kilograms of garbage from just 79,880 kilometers of coastal beaches. They found that the most frequent garbage items collected were cigarette butts, plastic bottles and caps, food wrappers, grocery bags, straws and stirrers, “take out” containers, beverage cans and bottles.
Millions of tonnes of plastics, which are produced for use in a variety of industries, are major contributors to aquatic trash and marine debris. According to one WHO report, 1,000-10,000 plastic particles per liter were found in freshwater and drinking-water sources.
Plastic debris has both land and ocean-based sources. Ocean-based sources include the fishing industry (discarded nets in particular), shipping, and aquaculture. Land-based sources include wastewater runoff, sewer overflows, littering, inadequate waste disposal and management, industrial activities, construction and illegal dumping.
This infographic by the team from China’s Northwest University in the iGEM synthetic biology competition shows different paths for microplastics to enter the environment.

Aquatic pollution by garbage and plastic has significant environmental and socio-economic negative effects. For example, a 2009 study by Keep America Beautiful reported that the US spends about $11.5 billion per year to clean up aquatic debris.
4. Radioactive Waste in Water
Radioactive waste is generated by radioactive mineral extraction, nuclear power plants, production and testing of military weapons, or medical institutions that utilize radioactive materials for research and medicine.
Accidental release or improper disposal of these contaminants can pollute surface water, groundwater, and seawater. Some of the radionuclides released can take thousands of years to decay and their removal imposes financial burdens on governments and industry worldwide. The most prominent example in recent times was the 2011 Fukushima nuclear power plant meltdown that released nuclear contaminants into the ocean that spread as far as North America. This report from The Guardian discusses how even a decade later, radioactive wastewater is accumulating and must be disposed of.
Radioactive waste materials in water can have a varied effect on human health based on the specific agents as well as dose and duration of exposure. For example, Uranium can cause acute kidney injury on exposure and its radioactive decay can cause cancer. When people are exposed to high levels of uranium in drinking water, indicators of kidney function are altered, which risks the development of potential kidney failure.
5. Oil Spills
Oil is an umbrella term that includes different chemicals such as jet fuel, gasoline, diesel, crude oil and various others. Oil Spills, normal shipping, run-off, and dumping damage the oceans on a daily basis.
The United States National Research Council (NRC) in a 2002 report stated that approximately 1.3 million tonnes of oil are released into the ocean each year, with the amount of oil pollution varying year by year based on the frequency and severity of global oil spills.
Sources of oil pollution vary but can include oil spills from large tankers, naturally occurring oil seeps, accidents and discharge from offshore drilling operations, leaking fuel tanks at refineries and retail service stations, as well as domestic, municipal and industrial wastewater.
Various components of oil such as volatile organic compounds (VOCs such as benzene, toluene, xylenes) and polycyclic aromatic hydrocarbons (PAHs) have been found by the United Nations Environmental Programme (UNEP) to be serious threats to human health. Benzene alone has been associated with hematologic disorders such as aplastic anemia and is a known human carcinogen. This video from chemical safety company Chemscape gives a full rundown of the dangers of benzene.
6. Water Pollution after Fracking
Fracking, or hydraulic fracturing, is a technique by which natural gas or oil is extracted from impermeable rock formations that lock these resources in. Water, specialized chemicals, and sand are shot at high pressure into the rocks so that the hydrocarbons can flow out of the new cracks that are created. The fracking boom has poisoned groundwater in some locations, according to years of research.
The fracking process involves concentrated chemical additives, mixing and pumping of fracturing fluids, as well as storage, transportation, and disposal of used fracturing fluid and wastewater. Errors in these processes can lead to spills and leakage leading to water pollution.
During the fracture process, the spread of oil and gas along unintended fracture lines may link them to underground water or aquifers furthering fracking-associated pollution.
Environment America Research and Policy Center in their report on impacts of fracking at the state and national level found that over 1,000 cases of ground and surface water contamination occurred due to drilling. For example, in the state of Colorado, approximately 340 of the leaks or spills reported by fracking operators over a five-year period polluted groundwater.
How Can Water Pollution Harm People?
When pollutants such as pesticides, fertilizers, trash, and septic systems find their way into an aquifer, they make water unsuitable for human consumption.
Water pollution can harm people via several different paths including the following three ways.
- Drinking water polluted by sewage
- Consuming water that contains chemical contaminants
- Consuming microplastics that are in polluted water
Such contaminated water reaches people via inappropriately managed urban, industrial, and agricultural wastewater which is allowed to enter surface water or groundwater. This leads to the chemical pollution and biocontamination of drinking water of hundreds of millions of people every year, increasing the rates of water-related disease morbidity and mortality.
The World Health Organization (WHO) paints a grim picture, reporting that approximately 2.2 billion people use unsafe water yearly which is the cause of some 829,000 preventable deaths. Science Advice for Policy by European Academies (SAPEA) echoes the same concern, warning that if plastic enters the oceans at a faster rate than it is today, it may create future health problems.
Water pollution not only imposes a significant health burden on society but an economic and social one as well. Water pollution leads to loss of productivity and wages, as people need to spend significant time and physical effort in collecting safe water. Healthcare expenditure for treating water pollution associated diseases imposes a significant economic burden, especially to developing countries.
1. Drinking Water Polluted by Sewage
Sewage was traditionally dumped directly into surface water (rivers, lakes, ocean) under the mantra “dilution is the solution”. From there, polluted water seeps into groundwater, resulting in even longer-lasting contamination.
In the developed world, water pollution by sewage has been sharply reduced, with most sewage going to water treatment plants. But in the developing world where there is insufficient treatment capacity or a lack of regulatory enforcement against polluters, sewage dumping remains a major problem. Breakdowns in treatment systems from accidents, war, natural disasters, or lack of maintenance cause regular discharge of sewage into water supplies. This map from the IHME’s Global Burden of Disease survey shows death rates from unsafe water sources which are generally contaminated by sewage.

The WHO reports that globally at least 2 billion people use a drinking water source contaminated with feces. This type of biocontamination is most widely linked with acute diarrhoeal diseases which are the result of waterborne infections with bacteria, viruses, or parasites. Frequent causes of water-related diarrhoeal diseases include cholera, E. coli, shigella, salmonella, coliforms, giardia, and various viruses.
Some 829 thousand people, of which 297 thousand are children aged under 5 years, are estimated to die each year from diarrhea as a result of sewage-contaminated unsafe drinking water.
2. Consuming Water That Contains Chemical Contaminants
Chemicals such as solvents, disinfection byproducts, pesticides, heavy metals, and radionuclides such as radium are examples of drinking water pollutants that can create long-term water pollution. Runoff of agricultural water contaminated with pesticides and fertilizers consistently finds its way into both surface and groundwater. Industrial chemicals and heavy metals find their way into the water supply, though more so in the developing world.
The toxic effects of water pollution pose significant health risks if ingested. Chemical toxins in water are causative factors for cancer, neuroendocrine disruption, cardiovascular, hepatic, and renal problems, as well as various reproductive health issues.
3. Consuming Microplastics That Are In Polluted Water
Microplastics have been found in almost all the world’s oceans including the Arctic. They can enter the water supply when plastic products are dumped into rivers, lakes, or the ocean and then slowly break down into microscopic pieces. In addition, many fabrics, creams, and other products which are washed or flushed down the drain contain small plastic elements.
While research is still in its early stages, microplastics are thought to be detrimental to both human health and marine ecosystems, which in turn supply humans with microplastic-infused seafood. Some estimates of the per capita consumption of microplastics by humans are shown below as researched by Doctors Kannan and Vimalkumar of the New York University School of Medicine.

Chemicals used in the production of plastic material, as well as contaminants that accumulate on the surface of microplastic during prolonged exposure to seawater, are toxic. Exposure to microplastics may be the result of contaminated water ingestion or more commonly from the consumption of microplastic contaminated seafood.
According to the study “Potential human health risks due to environmental exposure to nano- and microplastics and knowledge gaps: A scoping review” published in the Science of The Total Environment, these toxic chemicals have been linked with the development of cancer as well as various developmental, reproductive, neurological, and immune abnormalities in both humans and marine wildlife.
What Diseases and Health Problems Can Water Pollution Cause?
Diseases and health problems that water pollution can cause include waterborne diseases such as cholera and typhoid, water-washed diseases such as trachoma and typhus, and water-based diseases such as schistosomiasis.
Millions of people die every year due to the drinking of unclean water and inadequate sanitation, as outlined below in data from Statista. According to the University of Wales’ Centre for Research into Environment and Health, there is an almost endless list of infectious, toxic, neurologic, hematologic, and gastrointestinal water pollution diseases. The 2019 World Health Organization report on “Safer water, better health” lists 12 to 14 major diseases, adverse health outcomes or injuries that is associated in part with contaminated water.

Diseases and health problems that stem from water pollution and lack of access to clean water are termed “Water-Related Diseases” by the World Health Organization. These diseases are broken down into three main categories: waterborne, water-washed, and water-based.
- Waterborne diseases are caused by drinking water contaminated by pathogens transmitted from human or animal feces or urine. Waterborne diseases include most of the enteric and diarrhoeal diseases such as cholera, typhoid, amoebic and bacillary dysentery as well as a multitude of other diarrhoeal and non-diarrhoeal illnesses. Waterborne diarrhoeal diseases are estimated to affect over 1 billion people and cause 2.2 to 5 million deaths annually.
- Water-washed diseases occur when contaminated water is used for washing and personal hygiene. Water-washed diseases include conditions such as trachoma and typhus, which is transmitted from person to person. For example, trachoma, which is a type of blinding infectious conjunctivitis caused by Chlamydia trachomatis, is strongly associated with the absence of nearby sources of safe, uncontaminated water. In 1996 the WHO reported over 150 million active cases of trachoma of which approximately 5.9 million could lead to blindness.
- Water-based diseases occur when humans drink or wash using water that is contaminated by parasites. The most common form of water-based disease is Schistosomiasis, a type of parasitic disease, which affects over 200 million people every year and causes nearly 200 thousand deaths.
The WHO categorization of water-related diseases primarily focuses on infectious diseases that stem from biocontamination of water. However, a broad range of other diseases and health problems stem from water pollution.
- Liver damage can occur from chemical and heavy metal pollutants in water.
- Neurologic toxicity from pesticides and heavy metals.
- Disorders of reproduction and sexual maturation, particularly from pollutants like perchlorate which disrupt the endocrine hormones which govern sexual maturation and reproduction.
- Oncologic disorders of the gastrointestinal, urinary, and reproductive tracts can occur with numerous pollutants. For example, the International Agency for Research on Cancer has classified water contaminants such as arsenic, fluoride, nitrate, Microcystin-LR, and various haloacetic acids as carcinogenic to humans.
What Are the Death and Sickness Statistics Caused by Water Pollution?
Based on several reports by the World Health Organization during the 1990s, the estimated number of deaths due to water-related illnesses are estimated to be between 2 and 5 million per year.
|
Source |
Deaths per Year by Water Pollution |
|
World Health Organization 2000 |
2.2 million |
|
World Health Organization 1999 |
2.3 million |
|
World Health Organization 1996 |
More than 5 million |
|
World Health Organization 1992 |
4 million |
Currently, the WHO reports that nearly 2 billion people around the world lack safe drinking water and that approximately 829 thousand people, of which 297 thousand are children aged under 5 years, are estimated to die each year from water pollution-related diseases, particularly infectious diarrhea.
However, a report published by the Pacific Institute on Estimated Deaths from Water-Related Diseases 2000-2020 states that morbidity and mortality from water-related illnesses is inadequately monitored and poorly reported, so all statistics remain rough estimates.
The following data on the death rate per 100,000 individuals attributed to unsafe water sources for select countries comes from the 2017 Global Burden of Disease Study by the United States Institute for Health Metrics and Evaluation (IHME). The death rate in developing countries has been declining sharply over time, and the increases sometimes seen in developed countries are still at very low levels.
This chart gives death rates from unsafe water sources in the US, UK, and Canada. While the rising and lowering trends look large, the overall levels are very low at only about 0.01% to 0.1% of developing country death rates.

This chart gives death rates from unsafe water sources in major Latin American countries that have been successfully upgrading their water supply infrastructure.

This chart gives death rates from unsafe water sources in Africa and the Middle East which have been improving their water supply infrastructure but lag behind major Latin American countries.

What Are the Dangers of Water Pollution on the Environment?
The dangers of water pollution on the environment include physical, chemical, and biological damage with damaging effects on land and in the water.
Agricultural and industrial chemicals, metals, and plastic debris can have direct toxic effects on marine and land plant and animal life. The Thames and Seine rivers were declared biologically dead for decades because local water pollution had destroyed virtually all plant and animal life in the waterways.
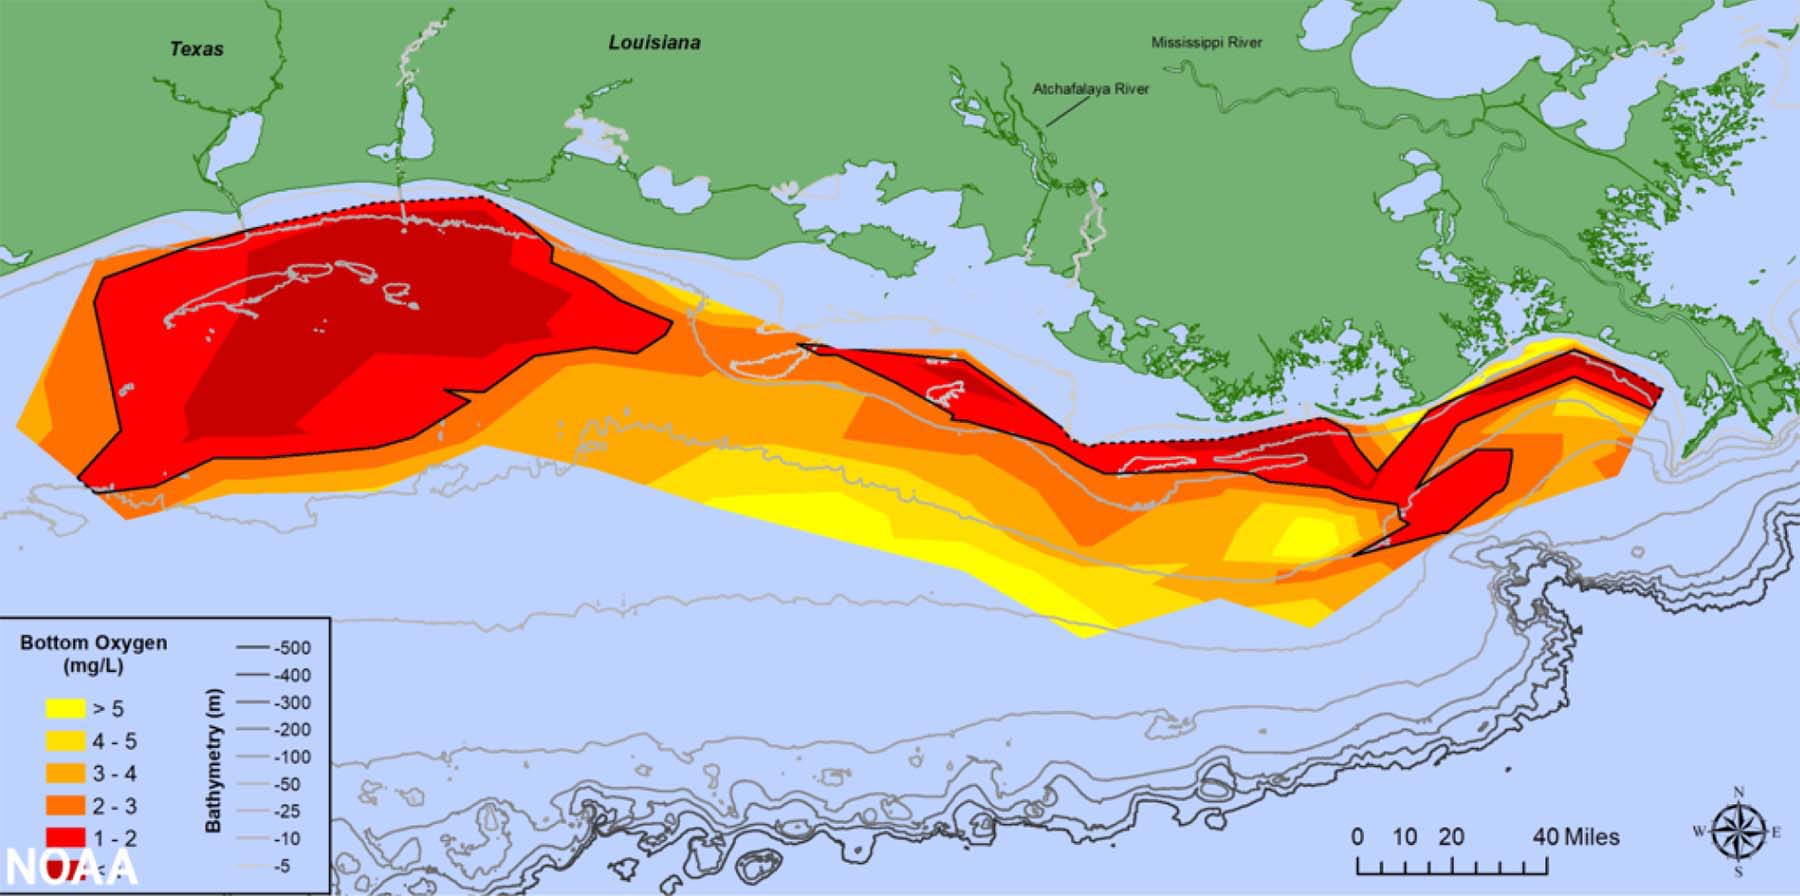
Water pollution can stimulate toxic algal blooms, depriving the water of oxygen and leading to death and contamination of numerous aquatic life forms, ranging from plankton to whales. The Gulf of Mexico has a large “dead zone” where fertilizer and chemical runoff from US farms, homes, and sewage systems has caused these algae blooms. This map from the US National Oceanic and Atmospheric Administration (NOAA) shows the extent of the dead zone in 2021.
Contamination of marine ecosystems with chemical and metal pollutants has indirect health effects on humans. For example, tuna and other large fish that humans consume as seafood often contain mercury in concentrations far higher than the surrounding water because of bioaccumulation up the food chain. Fruits and vegetables can pick up high concentrations of contaminants if irrigated with polluted water.
How Do Bottled Water Brands Prevent Water Pollution?
Bottled water brands prevent water pollution by protecting the environment around their source water, having the lowest carbon footprint of packaged beverages so as to prevent global warming’s effects on oceans and other bodies of water, and developing new packaging materials and processes that reduce plastic in the aquatic environment.
Tap water is a better environmental choice than bottled water when deciding between bottled water vs. tap water for your main daily consumption. This is because tap water has few transportation, packaging, manufacturing, or waste disposal impacts. But when a packaged beverage on the go is needed, or in situations where tap water is not safe, bottled water is environmentally better than soft drinks, juices, milk, or sports drinks.
These are three main ways bottled water brands help prevent water pollution.
1) Source water protection: Bottled water producers know that clean, non-polluted water sources must be available if they are to bring them to consumers. They are required by law and regulatory agencies such as the US FDA to maintain strict standards for the purity of their water. They must test the water regularly to make sure they meet these standards.
While precise testing parameters vary around the world, producers are generally required to test for dozens or even a hundred or more chemical, microbial, or radioactive water pollutants. Norwegian regulations (which are harmonized with EU standards) list 50 main test parameters. And in reality, the number is larger because many of the parameters such as pesticide classes include multiple sub-parameters. Failure to maintain these purity requirements can result in fines, product recalls, or even the loss of permission to sell.
Licenses to produce usually require surveys of the land and geology near the source to ensure that pollutants have not gotten into the soil or water table. Such surveys usually require an analysis of the amount of water that is drawn from the source without depleting it.
There have been cases such as Nestlé’s Arrowhead spring water in California being accused of overdrawing water sources, to the detriment of the community. This report from CBS This Morning gives an overview of the company’s operations and its critics.
Such scrutiny is important to halt the over-exploitation of water sources. Most bottled water brands know that they would be destroying their own business if they do not ensure their source water is clean and sustainably abundant.
2) Reduced greenhouse gas emissions: Global warming is a form of water pollution in that it results in acidified and warmer oceans and bodies of water. This can decimate local ecosystems such as via the mass bleaching of the Great Barrier Reef, or the invasion of Atlantic cod into the Barents Sea where they decimate the high-fat arctic cod populations which seals - the main prey of polar bears - depend on.
Bottled water has one of the lowest carbon footprints among packaged beverages. According to the food and beverage carbon impact calculator from industry experts My Emissions, bottled water produces 31.6 grams of CO2 equivalent per 100 milliliters of the product. This is 49% less than soft drinks, 82% less than milk, and 87% less than apple juice. For the occasions where alcoholic drinks are favored but where premium natural source Fine Waters are a growing non-alcoholic alternative, bottled water has 77% fewer emissions than wine, and 86% less than whiskey. These are typical category averages and will vary according to the packaging used (PET, glass, aluminum, etc.) and the distance the product travels.
|
Beverage |
Serving Size (ml) |
Emissions (gCO2e) |
g/100ml |
|
Bottled water |
500 |
158 |
31.6 |
|
Oatly Oat Drink |
200 |
64 |
32.0 |
|
Milk - plant-based |
200 |
109 |
54.5 |
|
Milk - almond |
200 |
113 |
56.5 |
|
Lemon Juice |
150 |
93 |
62.0 |
|
Lime Juice |
150 |
93 |
62.0 |
|
Soft drink |
330 |
205 |
62.1 |
|
Beer can |
330 |
218 |
66.1 |
|
Cider can |
330 |
218 |
66.1 |
|
Milk - soy |
200 |
156 |
78.0 |
|
Beer bottle |
500 |
438 |
87.6 |
|
Cider bottle |
500 |
438 |
87.6 |
|
Sherry |
150 |
205 |
136.7 |
|
Wine |
150 |
205 |
136.7 |
|
Flat White |
160 |
258 |
161.3 |
|
Fruit juice |
150 |
257 |
171.3 |
|
Milk |
200 |
352 |
176.0 |
|
Fruit cordial |
50 |
96 |
192.0 |
|
Orange juice |
150 |
300 |
200.0 |
|
Grapefruit juice |
150 |
309 |
206.0 |
|
Brandy |
50 |
116 |
232.0 |
|
Other spirits |
50 |
116 |
232.0 |
|
Rum |
50 |
116 |
232.0 |
|
Tequila |
50 |
116 |
232.0 |
|
Vodka |
50 |
116 |
232.0 |
|
Whiskey |
50 |
116 |
232.0 |
|
Apple juice |
150 |
366 |
244.0 |
|
Pineapple juice |
150 |
378 |
252.0 |
|
Milk - goats |
200 |
534 |
267.0 |
|
Milk - sheeps |
200 |
1680 |
840.0 |
Glass manufacturer O-I claimed in a peer-reviewed 2010 report on complete life cycle assessments (LCA - i.e., from the source of raw materials until final disposal or recycling) that glass packaging had the lowest CO2 footprint compared to PET plastic and aluminum. Specifically, they claimed that in Europe (Italy used as model area) a 355ml glass bottle would be responsible for 110 grams of CO2 emissions from cradle to cradle, compared to 122 grams for aluminum and 152 grams for PET. In the US they claimed 171 grams of CO2 emissions for glass, 401 grams for aluminum, and 214 grams for PET. This accounted for transportation distances to consumers as well as manufacturing and other processes. But in general, transportation had a small impact never greater than 10% of total emissions. If glass bottles are re-used, their carbon footprint can drop much further.
3) Developing environmentally friendly packaging materials and processes: Consumer awareness of the environmental and health impact of plastic has raised the pressure on bottled water companies. A 2015 paper by Jenna R. Jambeck et al. in the journal Science estimated that 4.8 to 12.7 million metric tonnes of plastic waste entered the ocean in 2010. Bottled water companies have responded not just by encouraging recycling, but by engineering thinner bottles that require less plastic, using more recycled plastic, supporting the development of bioplastics and biodegradable plastics, and adopting alternative packaging materials such as cardboard and aluminum. At least three small companies (Choose, Paboco, and Paper Water Bottle) are even producing paper pulp-based water bottles.
In this video, the Paper Water Bottle company describes its product and its environmental aspects.
It is true however that tap water is far less polluting than bottled water. A University of Michigan Center for Sustainable Systems study entitled “Comparative Life-Cycle Assessment of Bottled vs. Tap Water Systems” found that in the full life cycle of the product, tap water served in a glass cup versus local bottled water in a PET plastic bottle produced 92% less solid waste and emitted 90% fewer greenhouse gas emissions. This much lower level of water pollution, along with its lower cost, means that tap water is the best primary source of drinking water for most people. Bottled water has its uses for more limited emergency and enjoyment situations where it is the least polluting choice versus other packaged drinks.
How Does Svalbarði Prevent Water Pollution?
Svalbarði prevents arctic water pollution by using reusable and recyclable glass bottles, and by using sales revenue to fund greenhouse gas reducing projects that save 100 times more arctic ice than is utilized.
- Glass bottles: Svalbarði’s glass bottle is endlessly recyclable and does not cause water pollution by leaching petrochemical byproducts into the environment. Just as importantly, it is designed to be re-used as a carafe or for other elegant home, dining, or celebratory purposes. 12 international design awards and hundreds of clients telling us they love the bottle lead to its regular re-use with tap water. The bottle was designed to reflect the beauty of its arctic water source, which means people value it for its own sake even beyond the actual iceberg water. As a luxury water, it is thus less likely to be thrown into the environment like single-use plastic bottles, causing its average carbon footprint to drop with every re-use.
- Funding CO2 reducing projects: Every bottle of Svalbarði funds greenhouse gas reducing projects that make it not just carbon neutral but carbon negative sufficient to save 100 kg of arctic ice per bottle sold. Global warming has knocked the annual balance of Svalbard’s glaciers out of balance. In normal times, the 5 billion cubic meters of ice that calve off the glaciers covering 55% of Svalbard would be replenished by winter snow. But now, ice loss has sped up beyond replenishment rates. We realized that rather than watching that excess ice be permanently wasted melting into the sea, we could share a small amount of it with the world and use part of the revenue to help fight back against global warming to save our arctic home.
To date, the main project Svalbarði has funded has been for the Natural Capital Partner certified Sub-Saharan Africa Improved Water Infrastructure project. This project provides clean drinking water boreholes for rural communities in East Africa, saving people 2 hours per day gathering water and preventing disease. The boreholes mean the local environment and watersheds are not damaged by deforestation for wood to boil water, and greenhouse gas emissions are sharply reduced. This video gives an overview of the project’s operations.
Svalbarði is able to calculate the impact of these prevented greenhouse gas emissions thanks to research published in the journal Science in 2016 from the Max Planck Institute for Meteorology in Germany and the National Snow and Ice Data Center in the US. That study found a strong linear relationship of 3 square meters of arctic summer sea ice lost in the long run per tonne of CO2 emissions. Svalbarði’s full-cycle carbon audits tell us how many tonnes of CO2 removal we need to fund per bottle to ensure 100kg of ice is preserved.
While we realize all this is a drop in the bucket of what needs to be done to fight back against water pollution from solid waste and global warming, we believe we all need to do everything in our individual power to keep our waters healthy and clean.
Leave a comment